Posts

Showing posts from August, 2016

Demand ventricular pacing

Image
Demand ventricular pacing.  The P waves are seen better in lead I.  The underlying rhythm looks like a second degree type I.   

Sinus rhythm with a first degree block

Image
Sinus rhythm with a first degree block  

Dropped PACs and escape beats

Image
Dropped PACs.   There is an underlying first degree block  A dropped PAC occurs after the 5th complex.  The dropped P wave can be seen better in the AVF lead.  This is followed by an atrial escape beat (6th complex) and a junctional escape beat (7th complex).  A PVC (8th complex) is next. The 9th complex is a junctional escape beat.  A dropped PAC follows.  The 10th complex is another junctional escape complex.   

Sinus bradycardia with sinus arrhythmia

Image
Sinus bradycardia with sinus arrhythmia  

Sinus bradycardia with a run of non-sustained VT

Image
Sinus bradycardia with a run of non-sustained VT  

Pacemaker failure: Failure to sense

Image
Pacemaker failure: Failure to sense.   

Bigeminal PVCs and a couplet

Image
Bigeminal PVCs and a couplet  

Sinus rhythm with a run of VT

Image
Sinus rhythm with a run of VT.  The second page is a continuation of the first page.  

Polymorphic VT

Image
Polymorphic VT  

Sinus rhythm with a run of non-sustained VT

Image
Sinus rhythm with a run of non-sustained VT  

First degree block with some ventricular escape beats

Image
First degree block with some ventricular escape beats.   In lead II a PVC (2nd complex) is seen.  The PR interval of the 3rd complex is prolonged.  The 4th complex is sinus with a first degree block.  The 5th complex is a PVC.  A dropped beat follows the PVC.  You can see it better in lead I.  This is followed by 4 ventricular escape beats.  In lead I it looks like some dissociated P waves are present with the escape beats.   

Second degree heart block type I

Image
Second degree heart block type I with 2:1 conduction

Ventricular paced with a run of non-sustained VT

Image
  Ventricular paced with a run of non-sustained VT.  The 6th complex is a fusion complex.  The pacemaker fired off at the same time as the PVC.  This is followed by a 6 beat run of VT.  A pause follows the run of VT and ventricular pacing resumes. 

Sinus rhythm changing to bigeminal PVCs

Image
Sinus rhythm changing to bigeminal PVCs  

Atrial flutter

Image
Atrial flutter with 5:1 conduction  

Sinus rhythm with an R-on-T PVC changing to SVT

Image
Sinus rhythm with an R-on-T PVC changing to SVT  

Sinus rhythm changing to accelerated idioventricular rhythm

Image
The initial beat is a sinus beat then the rhythm changes to an accelerated idioventricular rhythm.   

Sinus rhythm with a short run of VT and hemodynamic effects on the arterial blood pressure

Image
Sinus rhythm with a short run of VT.  This page shows the hemodynamic effects of VT. During the initial four beats the systolic arterial blood pressure (AR2 waveform)is around 120 mm Hg.  However, during the short run of VT the systolic arterial pressure drops to around 80 mm Hg. 

Atrial fibrillation with some ventricular escape beats

Image
Atrial fibrillation with a slow ventricular response and escape beats.   The QRS complexes are wide in the underlying rhythm.  Complexes 1 - 3 show the patient's underlying heart rhythm.  Complexes 4 and 5 are ventricular escape beats that arrive later in the cardiac cycle.   

Sinus bradycardia with an exit block

Image
Sinus bradycardia with exit block  

Sinus rhythm with multifocal PVCs and non-conducted P waves

Image
Sinus rhythm with multifocal PVCs and non-conducted P waves.  The rhythm begins as sinus rhythm, complexes 1 - 6.  A multifocal couplet makes up complexes 7 and 8.  This is followed by a brief pause.  Next is a 4 beat run of polymorphic VT.  A P wave is seen before the first PVC of the run and in between the 10th and 11th complexes.  A nonconducted PAC follows the last complex of the run (12th complex). This is followed by a period of arrest.  Another nonconducted P wave is seen during the period of arrest.  A nonconducted PAC occurs after the 14th complex.  

Sinus tachycardia

Image
Sinus tachycardia  

Supraventricular tachycardia

Image
Supraventricular tachycardia  

Second degree Type I changing to second degree type II

Image
Second degree Type I changing to second degree type II.  This patient switched back and forth between a type I block and a type II block.  

Atrial fibrillation changing to ventricular tachycardia

Image
These two pages show are a continuous rhythm of atrial fibrillation changing to ventricular tachycardia.     

Atrial fibrillation with a slow ventricular response and arrest

Image
Atrial fibrillation with a slow ventricular response and a long period of arrest  

Sinus rhythm with a triplet and couplet of PVCs

Image
Sinus rhythm with a triplet and couplet of PVCs  

Sinus bradycardia with ventricular escape beats

Image
In these two pages the patient is having sinus bradycardia with ventricular escape beats.  The underlying rhythm is sinus bradycardia.  The 5th complex is a PVC.  It is followed by two ventricular escape beats.  Sinus bradycardia resumes after the escape beats.   

A competing junctional rhythm

Image
A competing junctional rhythm.  A sinus beat starts the rhythm.  The 2nd beat is a PVC or an aberrantly conducted PJC?  It looks like an inverted P wave follows the QRS complex on the 2nd beat.  The next three beats are junctional escape beats with inverted P waves that follow the QRS complexes.  The 6th complex arrives early, a PAC.  The rhythm then reverts back to sinus rhythm.

Sinus rhythm with 4 beat run of VT changing to bigeminal PVCs

Image
Sinus rhythm with 4 beat run of VT changing to bigeminal PVCs.  The P waves are tall and suggesting right biatrial enlargement. 

Sinus rhythm with non-sustained VT

Image
Sinus rhythm with non-sustained VT  

Bigeminal dropped PACs

Image
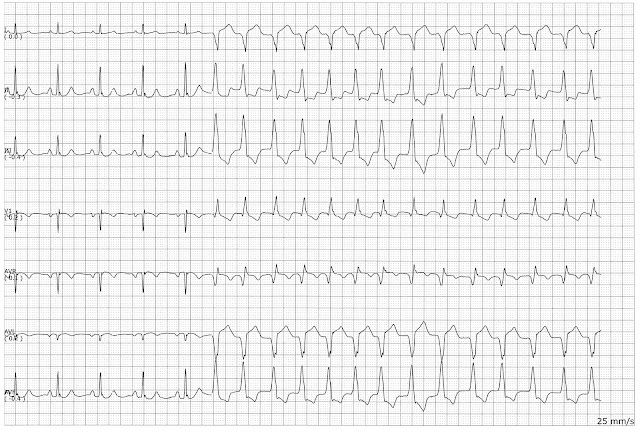
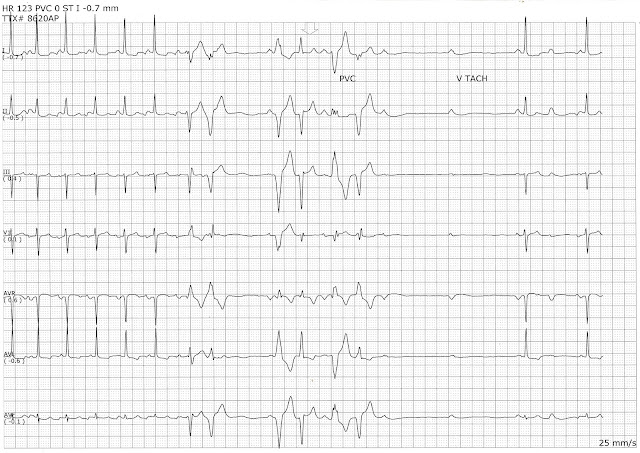
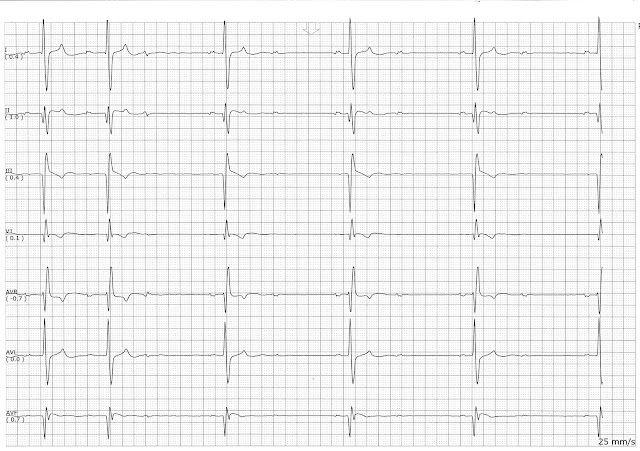
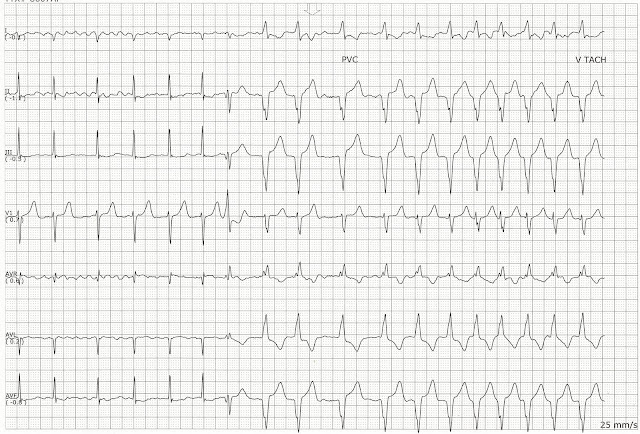
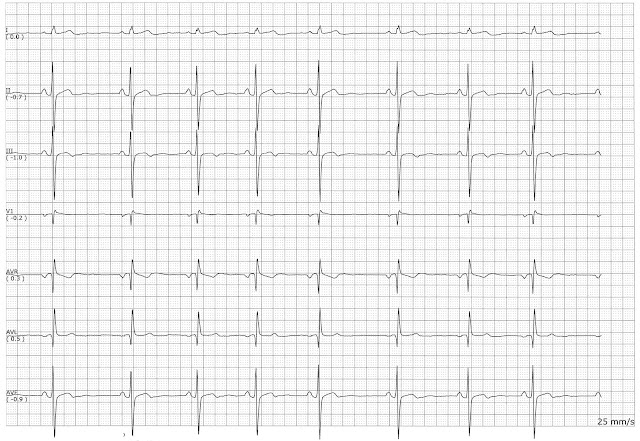
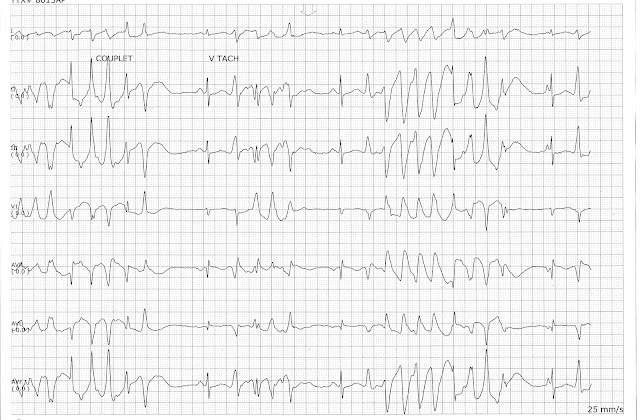
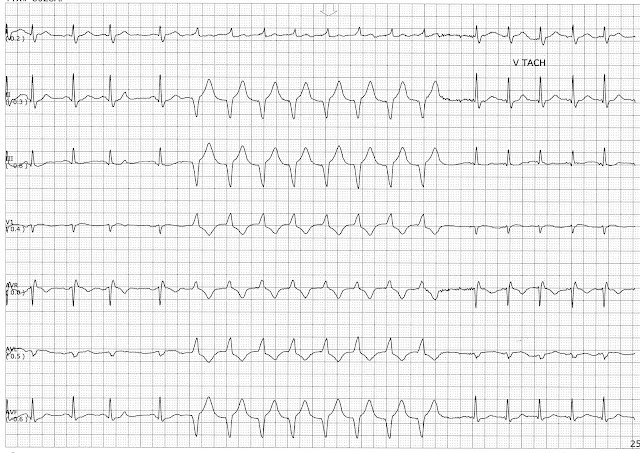
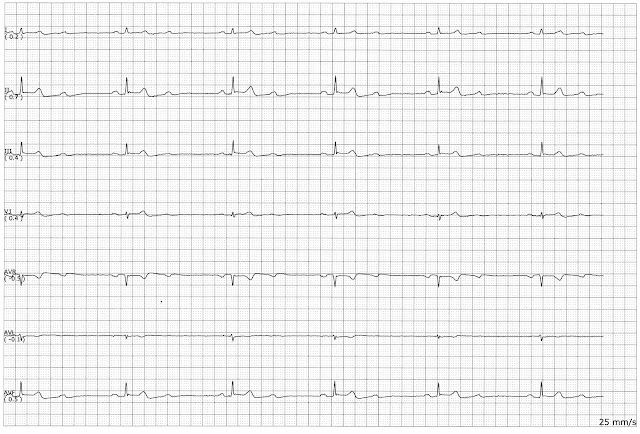
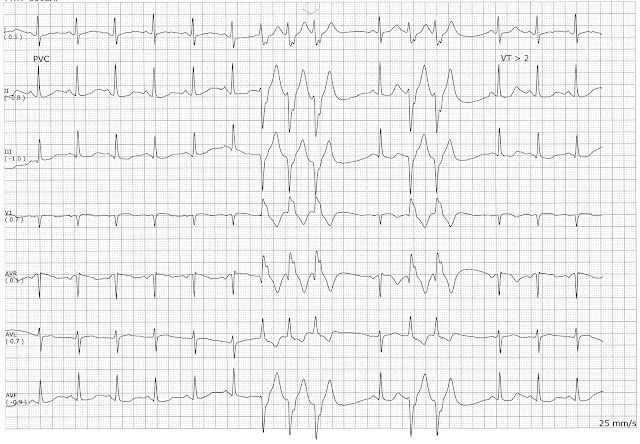
These three rhythms strips belong to the same patient.  If you examine the morphology of the early beats in the first two strips you can seen the same morphological changes in the T wave when a nonconducted PAC occurs.  In the very last strip, those same characteristics are seen in a bigeminal pattern. In this strip, the patient is showing what appears to be aberrantly conducted PACs in a quadrigeminal pattern.  The change in the height of the T wave before each ectopic beat leads me to believe that they are atrial in origin.  I have circled the ectopic P waves for comparison in the next strips. In this second strip.  The early beat of complex 4 shows the same kind of P wave.  Then another nonconducted P wave is seen after complex 5.  If you look at the morphology of these P waves in aVL the look the same.  The same pattern is seen in complexes 9 and the nonconducted beat after complex 10 Keeping in mind the morphological similarities of these complexes, now examine t