I have been in nursing for 40 years and have worked in a variety of settings including hospice, long term care, med-surg, supervision, cath lab, ER, special procedures and critical care. I enjoy working as a float nurse because it gives me a variety of clinical experiences. I am also a CPR, ACLS, and PALS, TNCC, ENPC instructor at our local hospital.
This is an interesting strip. The patient has a ventricular pacemaker for what looks to be complete heart block. The lead V1 you can see dissociated P waves. In lead III we can see where the pacemaker has failed to capture resulting in a period of arrest. In the V1 lead you can see the dissociated P waves more clearly during the period of arrest. The bottom lead is an arterial wave form and you can see the dramatic fall in the blood pressure during the episode of the loss of capture.
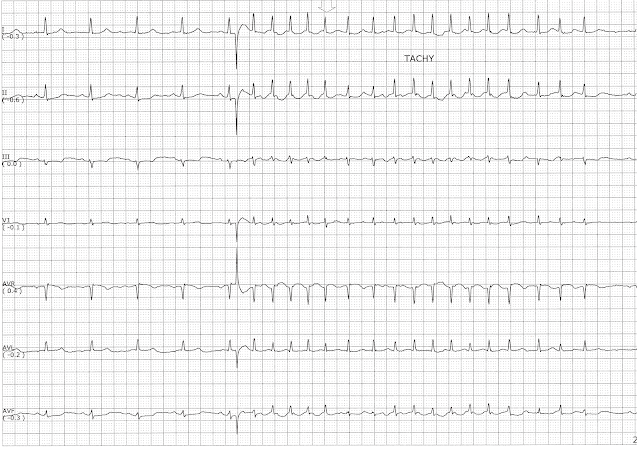
In this page the patient is in sinus rhythm. Then a PVC occurs on the 5th complex and it induces a run of an atrial ectopic rhythm. The width and morphology of the QRS complexes do not change, so I think that it is supraventricular. In leads I and II, it looks like there are some occasional P waves that look different from the sinus P waves.
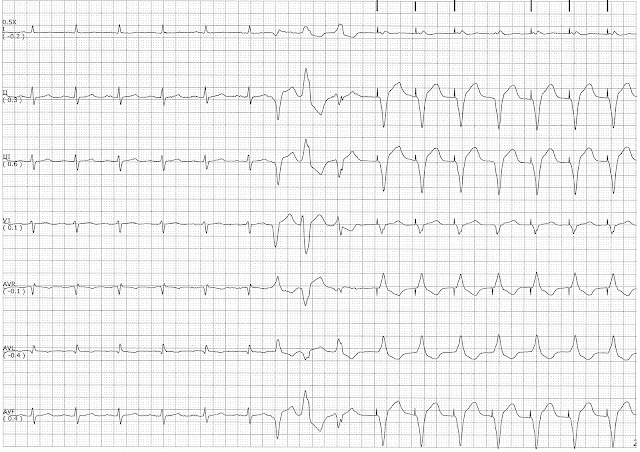
This a 7 lead rhythm summary that I printed from our monitor of a patient in atrial fibrillation. Hopefully you can enlarge it on your computer. The QT interval is about .44 sec. A couplet occurs right after the T wave and induces a run of VT. Not quite an R-on-T episode but very close. Perhaps enough of the ventricle was still in a relative state of depolarization to induce the run of VT.