I have been in nursing for 40 years and have worked in a variety of settings including hospice, long term care, med-surg, supervision, cath lab, ER, special procedures and critical care. I enjoy working as a float nurse because it gives me a variety of clinical experiences. I am also a CPR, ACLS, and PALS, TNCC, ENPC instructor at our local hospital.
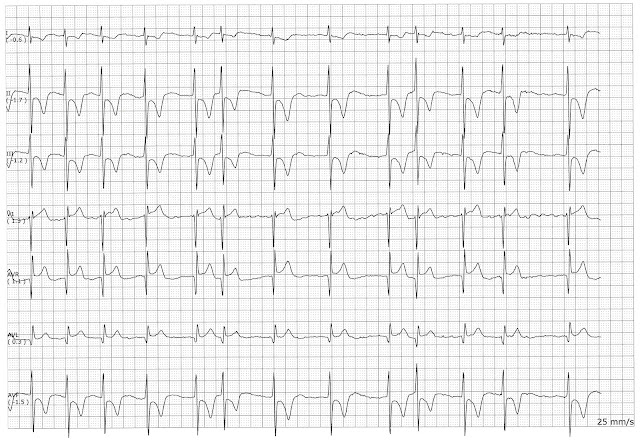
The rhythm is irregular due to the run of VT. An upright, uniform P wave is seen before the QRS complexes. The QRS complexes are wide. An 8 beat run of VT is seen. During the run of VT there appear to be some dissociated P waves that follow the QRS complexes.
The rhythm is irregular. An upright P wave is paired with a QRS complex. The PR interval is prolonged. We have multifocal PVCs present. A pause follows the PVCs. The 2nd PVC is followed by some ventricular escape beats.
The are multiple and consecutive PACs present. It even looks like there is a dropped PAC that follows the 1st,6th, 12th, and 13th complexes. The 1st, 7th, 13th, and 14th complexes look like junctional escape beats.
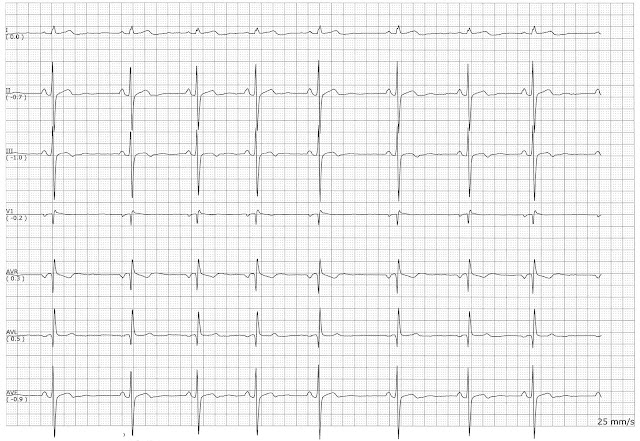
The rhythm is irregular. The difference between the longest and shortest R - R interval is grater than .12 sec. There is one P wave for every QRS complex. The P waves are uniform and upright.
It looks like there are dropped PACs that follow the complexes 1 - 5. If you compare the T waves in complexes 1 - 5 with complexes 6 - 10, you can see that the T waves are flatter. The T wave of the 5th complex looks split suggesting that there might be a dropped P wave.
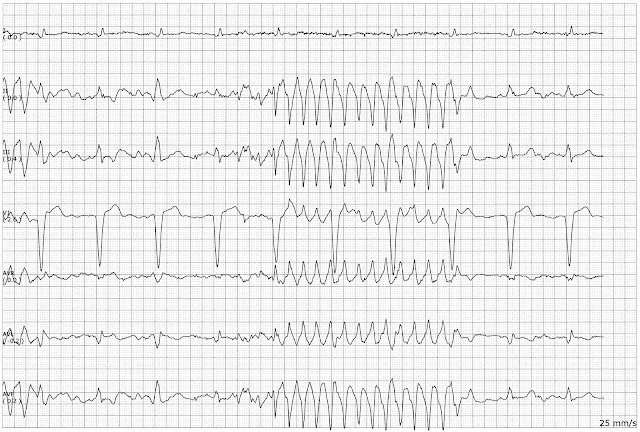
There is a significant change in the morphology of the QRS complexes. The presence of P waves suggest that there is aberrancy present as opposed to a ventricular rhythm
At first glance this looks like a run of ventricular tachycardia. But if you look at the V1 lead, you can see that there are organized complexes that present.