Posts

Showing posts with the label Arterial blood pressure waveform

Arterial blood pressure waveform

Image
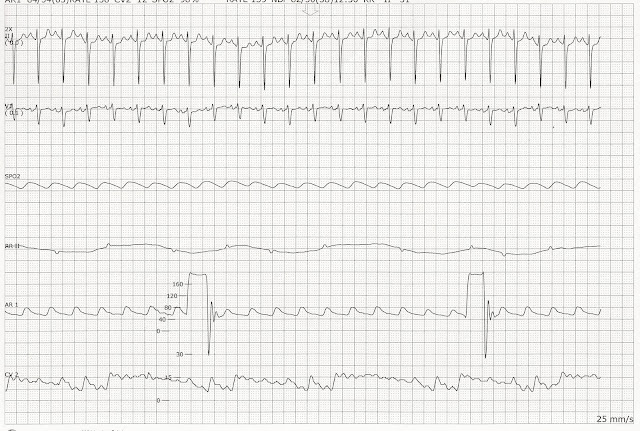
Sinus tachycardia.  This patient had an arterial line and a CVP.  The square wave test was done on the arterial line to evaluate the system dynamics.  Two to three oscillations should follow a fast flush of the system.   

Sinus rhythm with a short run of VT and hemodynamic effects on the arterial blood pressure

Image
Sinus rhythm with a short run of VT.  This page shows the hemodynamic effects of VT. During the initial four beats the systolic arterial blood pressure (AR2 waveform)is around 120 mm Hg.  However, during the short run of VT the systolic arterial pressure drops to around 80 mm Hg. 

Ventricular Tachycardia with a Significant Drop in the Arterial Blood Pressure

Image
On this page, the patient has a ventricular pacemaker.  He has a long run of VT with a significant drop in his arterial blood pressure.  This strip shows why a person can become hemodynamically unstable with VT.

EKG Rhythm Strips of Unstable SVT with Arterial Blood Pressure Waveform

Image
These rhythm strips are from a patient who developed SVT.   His arterial blood pressure was being monitored at the time.   You can visualize the hemodynamic effects of the rhythm on the arterial pressure and see that this would significantly reduce end-organ profusion.  Heart rate around 150 with BP around 90/54. Arterial Blood Pressure Waveform and SVT  Heart rate over 200.   Systolic pressures 78-84.  Diastolic pressures 50-60s Arterial Blood Pressure Waveform and SVT The patient spontaneously converted without electrical or pharmacological interventions. Supraventricular Tachycardia Showing Loss of Arterial Blood Pressure

Multiple PVCs

Image

Various rhythms with arterial blood pressure waveform

Image
1. The arterial blood pressure is measured by a sensor that is placed in either the radial artery or the femoral artery.  It should correlate closely with the peripheral cuff pressure.  In this strip, there is a slight delay between the arterial waveform and the cardiac waveform.   This reflects the time that it takes for the pressure produced by the cardiac contraction to travel from the heart to the radial artery where the arterial blood pressure sensor is positioned.  Notice how the arterial waveform flattens out and the blood pressure drops during the ventricular beats.   2. The scale on the left is used to measure the arterial pressure.   In this strip the arterial pressure is between 180/80 and 200/100.  The small indentation on the down slope of the arterial waveform, called the dichrotic notch, correlates with closure of the aortic valve. 3. The arterial pressure is low, around 80/50.   As in the anal...